Essay · 2023
Speed Matters
Bandwidth, latency, and why the last mile still decides how fast the internet feels. Originally written in 2023 as an internal networking primer; republished here with company-specific material removed.
Bandwidth and latency
It’s all about speed
The rapid adoption of cloud-based technologies and distributed systems is a signal of how much speed matters — and how much people notice when it’s missing. This isn’t just an anecdote about the need for speed. It’s empirically tied to customer engagement, retention, and conversion.
Speed is a feature you can deliver. To deliver it well, you need a clear model of the factors and limits that shape it.
Two major factors dominate that model: bandwidth and latency.
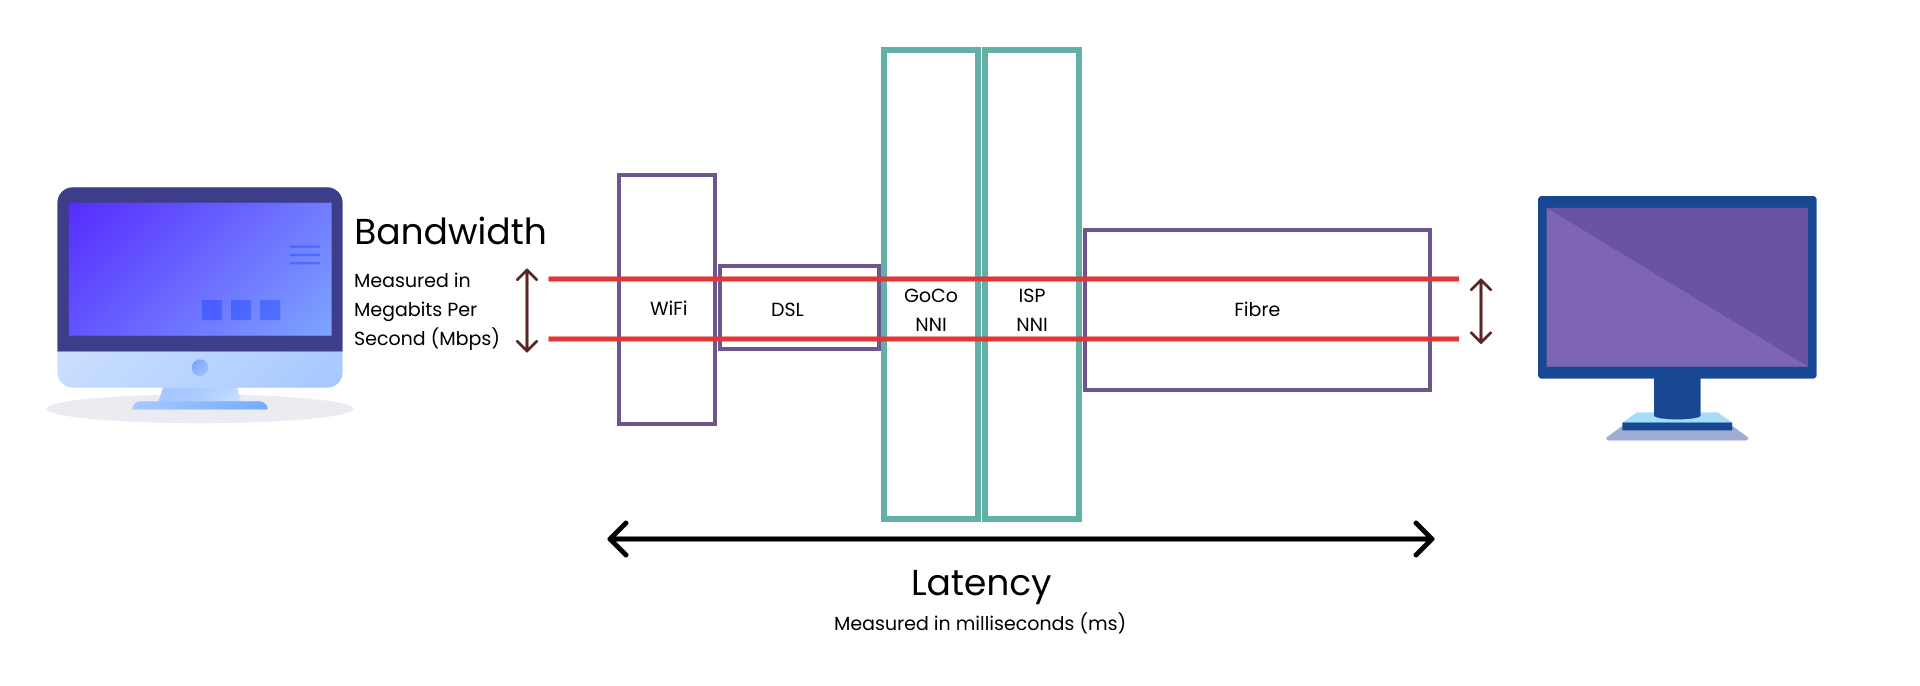
Bandwidth: Maximum throughput of a logical or physical communication path.
Latency: The time from the source sending a packet to the destination receiving it.
Let’s talk latency
Latency is the time it takes for a packet, or message, to get to its destination from its source. That definition is useful, but it hides the mechanics. Latency is really a measure of delay in a system — and delays accumulate all along a packet’s path.
Processing delay is the time required to process the packet, check for errors, and determine the outgoing path.
Queueing delay is the time a packet waits to be processed.
Propagation delay is the time it takes for the signal to travel the physical distance between two locations.
Transmission delay is the time it takes to put the packet onto the link. It depends most on how much information is being sent relative to the available bandwidth.
Latency is the sum of these delays. Information takes time to travel — limited by the type of connectivity and, ultimately, the speed of light. Transmission delay is shaped by available bandwidth on a circuit. Write a 10 MB file over a 5 Mbps link and it takes about 16 seconds. Over a 1 Mbps link, the same file takes about 80 seconds.
Important note: Network traffic is measured in bits per second (bps). File sizes are usually measured in bytes (B). Each byte contains 8 bits. Check whether something is measured in bits (Kb, Mb, Gb) or bytes (KB, MB, GB).
When a packet arrives at a router, the router inspects the header to choose an outgoing route. It may also validate the packet at the bit level. If another packet arrives while that work is underway, the new packet waits in a buffer — queueing delay.
These delays happen at every hop between origin and destination. The farther a packet must travel, the more propagation time it pays, the more routers it traverses, and the more delay it accumulates.
299,792,458 metres per second (c)
The speed of light — at least in a vacuum. Why does that matter here? c is the maximum speed at which energy and information can travel in the known universe, and that includes packets on a network.
c is fast. Fast enough to cover the 5,022 km from Vancouver to St. John’s in a little over 16 ms in a vacuum. Network infrastructure doesn’t live in a vacuum. Over optical fibre — where packets spend most of their propagation time — the refractive index of the glass slows light down.
A typical single-mode fibre used for telecommunications has a cladding of pure silica with an index of about 1.444 at 1500 nm, and a core of doped silica around 1.4475. The larger the index of refraction, the slower light travels in that medium.
In practical terms, packets move through fibre at roughly 200,000,000 m/s. Vancouver to St. John’s becomes about 25 ms one way, or ~50 ms round trip — still very fast.
Those numbers are “as the crow flies.” Packets don’t travel in a straight line. On a real path across Canada, traffic routes through intermediate nodes. Each hop adds a little delay. Information that could theoretically arrive in under 30 ms often lands closer to 200–300 ms.
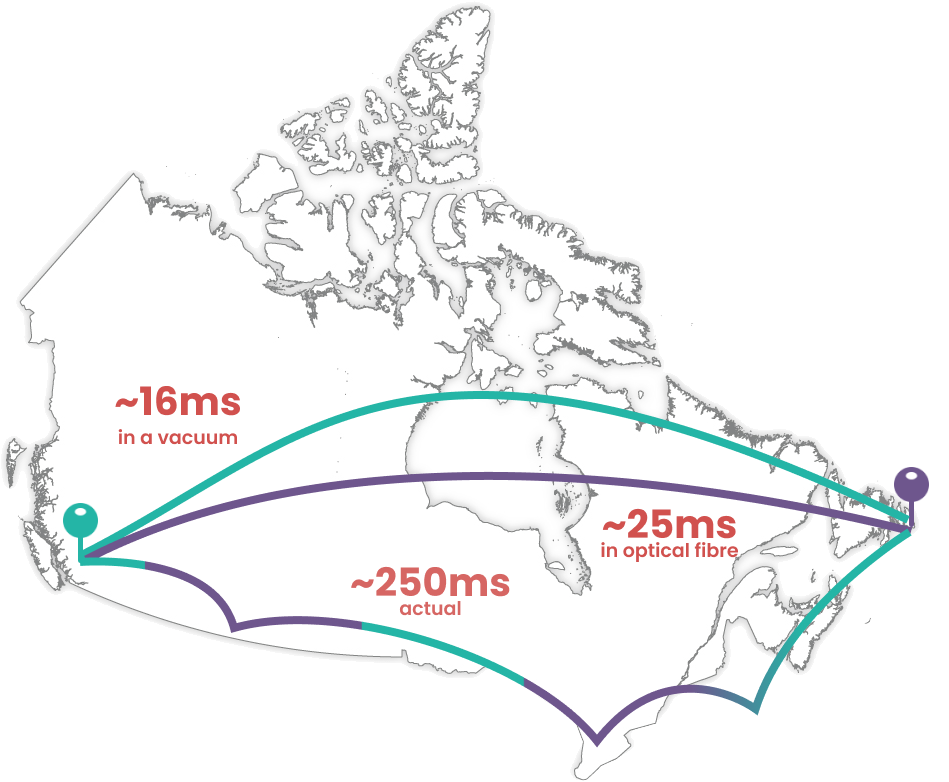
250 ms doesn’t sound like much, but delays above ~300 ms start to feel like lag in a browser. Above ~400 ms, people report visible, perceptible lag.
The practical goal for anyone delivering connectivity or online experiences is simple: minimize latency wherever you can for the client and their end users.
🌎 By placing servers in multiple locations, latency falls because content is closer to the end user. Distance shrinks. Hop count shrinks. Perceived speed rises.
The last mile difference
Before a packet ever crosses the 5,000+ km span of Canada from Vancouver toward St. John’s — and again just before it arrives — it traverses one of the most latency-sensitive parts of the path: the last mile.
In the last mile, service providers route cables through neighbourhoods and usually terminate at a local node. Latency here depends heavily on the access technology in place.
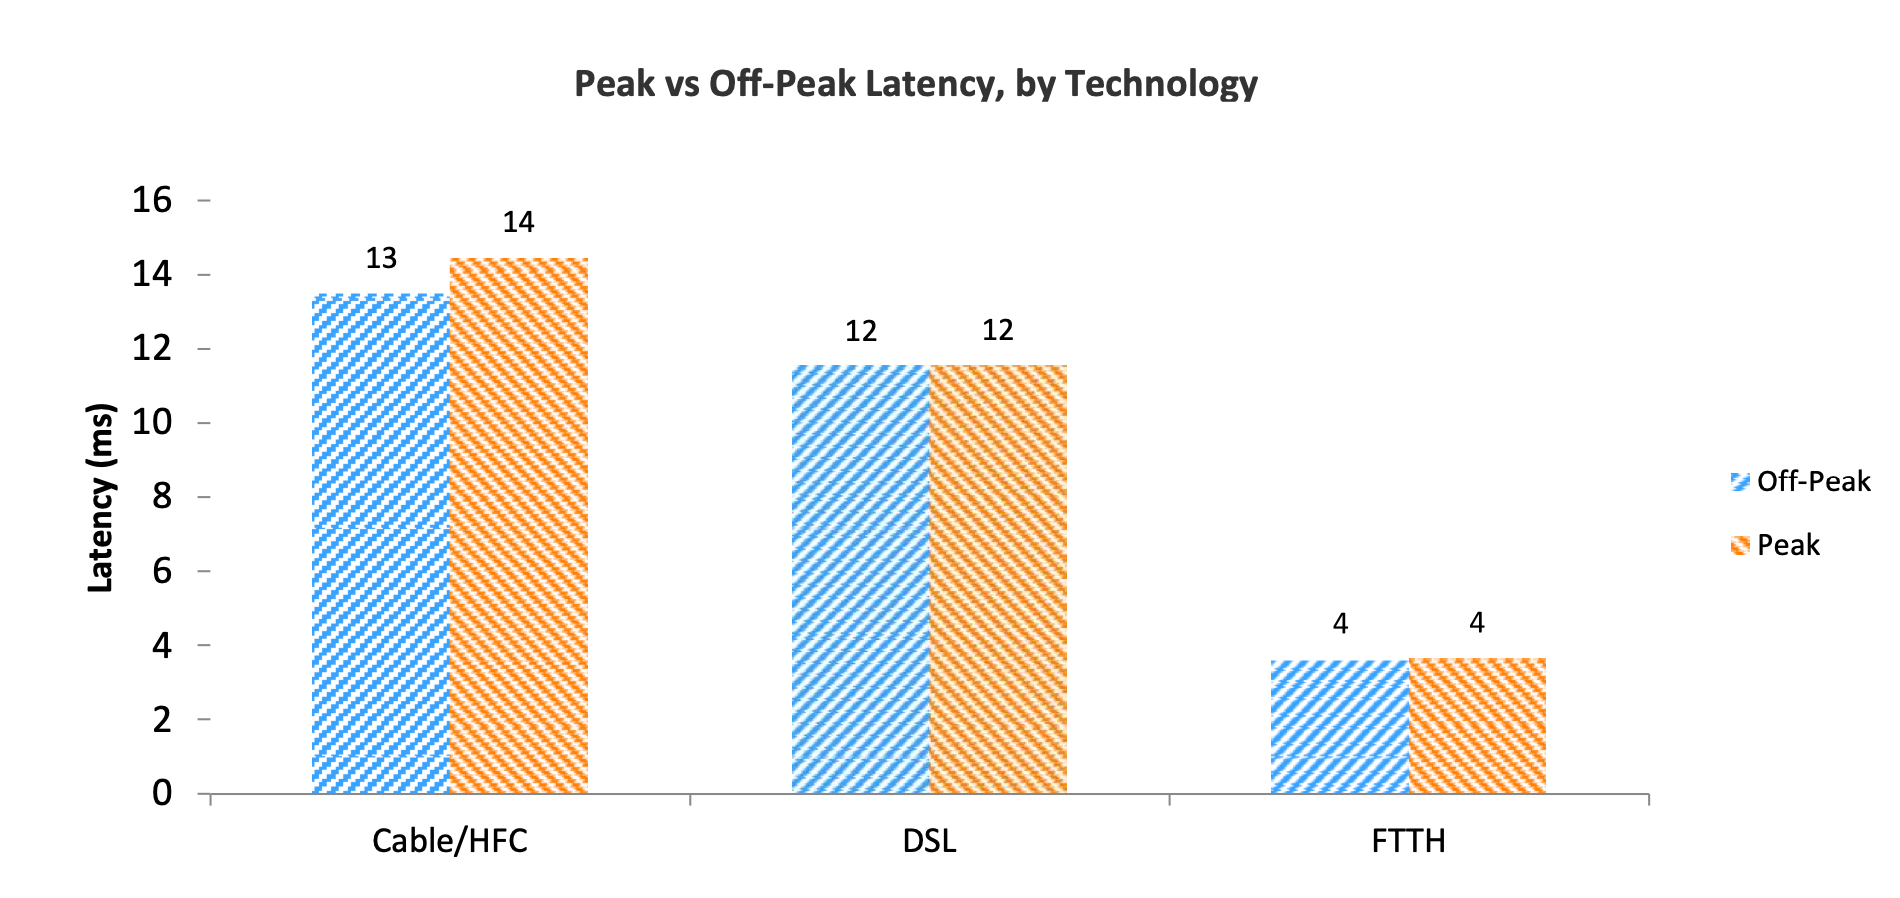
In the CRTC’s 2020 Measuring Broadband Canada report, Tier 1 and Tier 2 cities showed roughly:
- Cable: 13 ms
- DSL: 12 ms
- FTTH: 4 ms
Outside metro centres, the same report recorded:
- Cable: 26 ms
- DSL: 25 ms
- FTTH: 11 ms
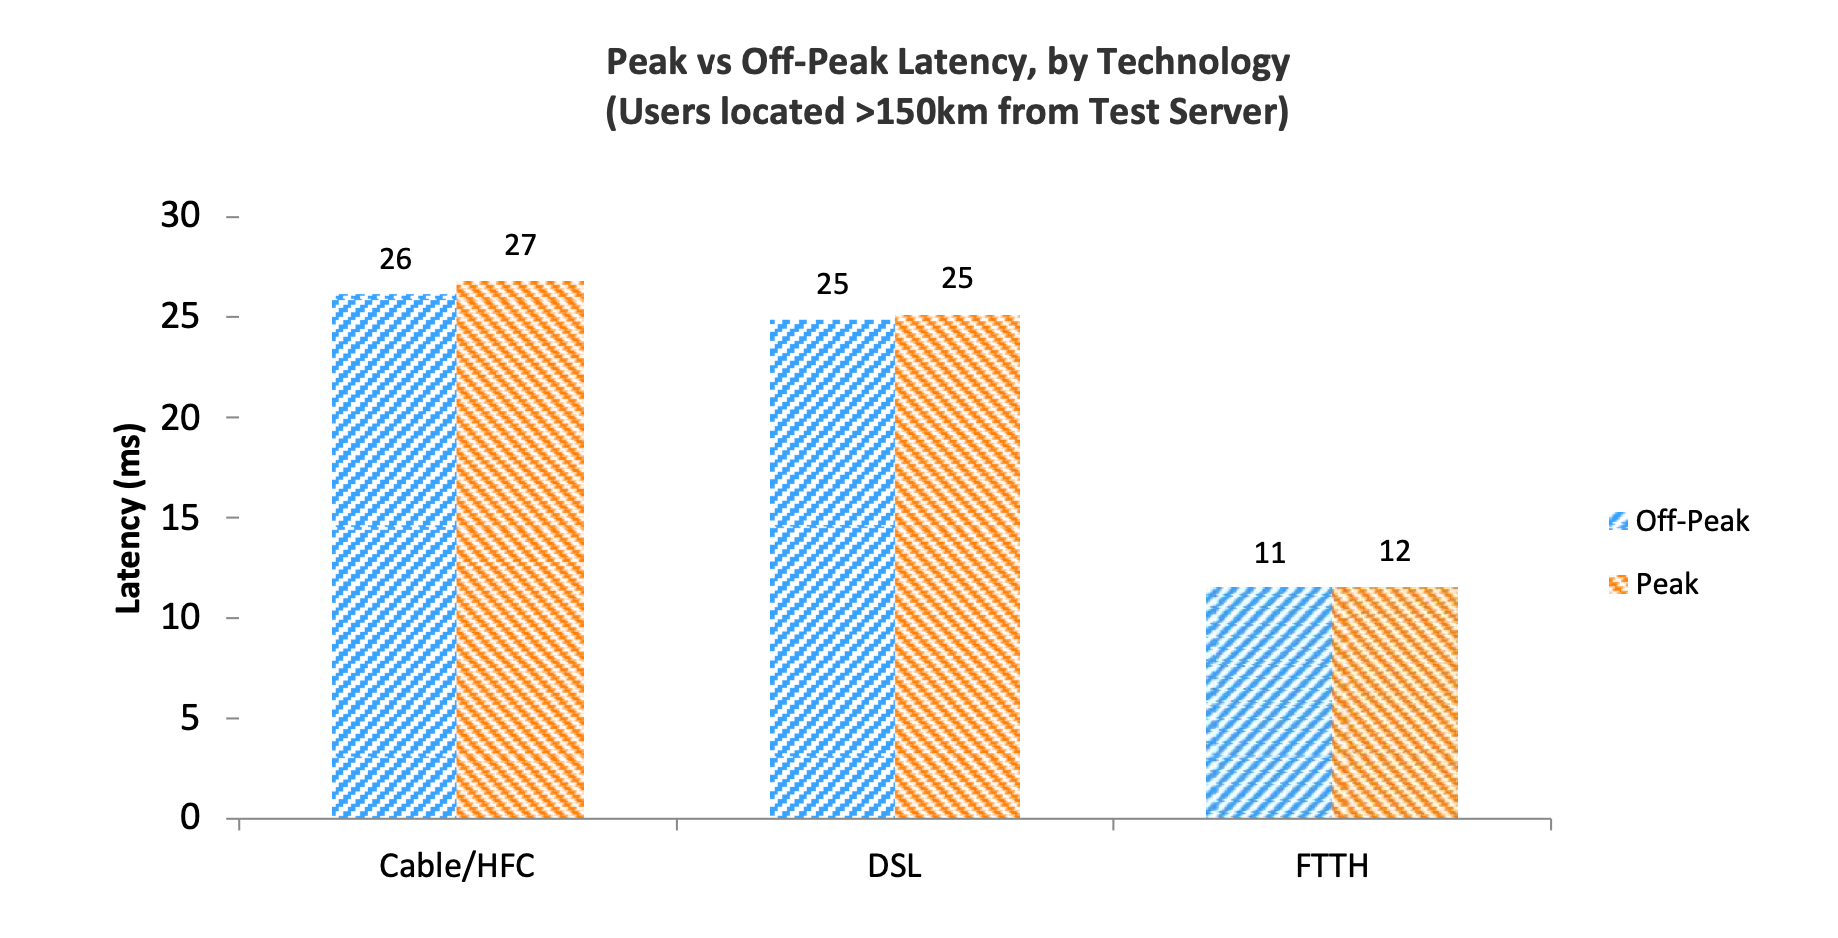
Those gaps show both transmission and propagation effects. Non-metro paths tend to cover more distance. Older last-mile technologies add more delay than fibre to the home.
If you want to see your own last-mile contribution, run traceroute (or tracert on Windows). Each hop’s timing tells you where delay is stacking up.
  1     2 ms     1 ms     1 ms  NATHANIELS-AIRP   <-- wireless router
  2    14 ms    18 ms    17 ms  10.196.46.1       <-- local ISP
  3    13 ms    17 ms     9 ms  198.251.51.69
  4    14 ms    13 ms    11 ms  172.23.1.33
  5    14 ms    14 ms    12 ms  198.251.50.16
  6    26 ms    48 ms    12 ms  74.125.50.233
  7    14 ms    15 ms    13 ms  74.125.244.145
  8    13 ms    14 ms    14 ms  216.239.49.189
  9    16 ms    12 ms    14 ms  yyz12s08-in-f14.1e100.net  <-- Google server
In this example, the packet started in Burlington, ON, bounced through the ISP in Vaughan, and reached Google’s YYZ-12 server. Average end-to-end was about 14 ms — excellent, largely because the destination was nearby.
What about a server in Calgary?
  1     1 ms     1 ms     1 ms  NATHANIELS-AIRP   <-- wireless router
  2    11 ms    13 ms    10 ms  10.196.46.1       <-- local ISP
  3    13 ms    11 ms    13 ms  198.251.51.69
  4    14 ms    14 ms    13 ms  172.23.1.33
  5    14 ms    16 ms    16 ms  198.251.50.16
  6    21 ms    20 ms    19 ms  xxx.ccr21.cle04.atlas.cogentco.com  <-- Cleveland
  7    27 ms    26 ms    26 ms  xxx.ccr41.ord01.atlas.cogentco.com  <-- Chicago
  8    26 ms    26 ms    27 ms  xxx.ccr41.ord03.atlas.cogentco.com  <-- Chicago
  9    25 ms    27 ms    27 ms  38.88.205.10                          <-- Chicago
 10    58 ms    59 ms    57 ms  xxx.int.shawcable.net                 <-- Calgary
 11    71 ms    74 ms    68 ms  184.68.102.2                           <-- Red Deer
Routing starts the same way: home network, local ISP, Vaughan. Then the ISP hands off to a Tier 1 provider (Cogent here). Traffic goes Cleveland → Chicago, then the ~1,500 km hop into Calgary (~30 ms), then roughly another 10 ms on the last mile into Red Deer. End-to-end averages just over 70 ms.
In the first example there was effectively no destination-side last mile — the ISP was likely co-located with the Google server — so last-mile cost was paid once (~10 ms). In the second, last mile appears at both ends, and that cost shows up twice.
Last-mile latency varies a lot by technology, load, and even time of day.
🗺️ Traceroute is a simple path diagnostic. It sends sequences of packets toward a destination with an increasing hop limit, stops at each hop, and measures the delay. Learn more.
How to deliver higher bandwidth and lower latency
Latency is ultimately bounded by the speed of light. Even a dedicated fibre between two distant machines still has propagation delay. The durable fix is architectural: put the resources people need closer to where they are — more points of presence, caches, and edge locations, not just a fatter pipe in one place.
Bandwidth is bounded by the connectivity you can actually provision. Where building new fibre is cost-prohibitive, the practical move is often aggregation: combine multiple lower-bandwidth paths so usable capacity rises even when no single circuit is enough.
Closing
Speed is not one number on a speed test. It is the product of how wide the pipe is, how long the path is, how busy every queue along that path is, and how many times the packet has to stop and ask for directions.
If you remember only three things from this note:
- Bandwidth is capacity. Latency is delay. Raising one does not automatically fix the other.
- Physics sets a floor. Fibre is fast, but it is still slower than c, and real routes are never straight lines.
- The last mile often decides how the network feels. Long-haul can look fine on a map while the hop from the neighbourhood node to the living room is where users lose patience.
Measure with traceroute. Design for distance. Prefer technologies that shorten the path. And when you can’t dig more fibre, bring the work closer to the user.
Written 2023. Figures from CRTC Measuring Broadband Canada (2020).